IELTS Writing Recent Actual Test 17
WRITING TASK 1
You should spend about 20 minutes on this task
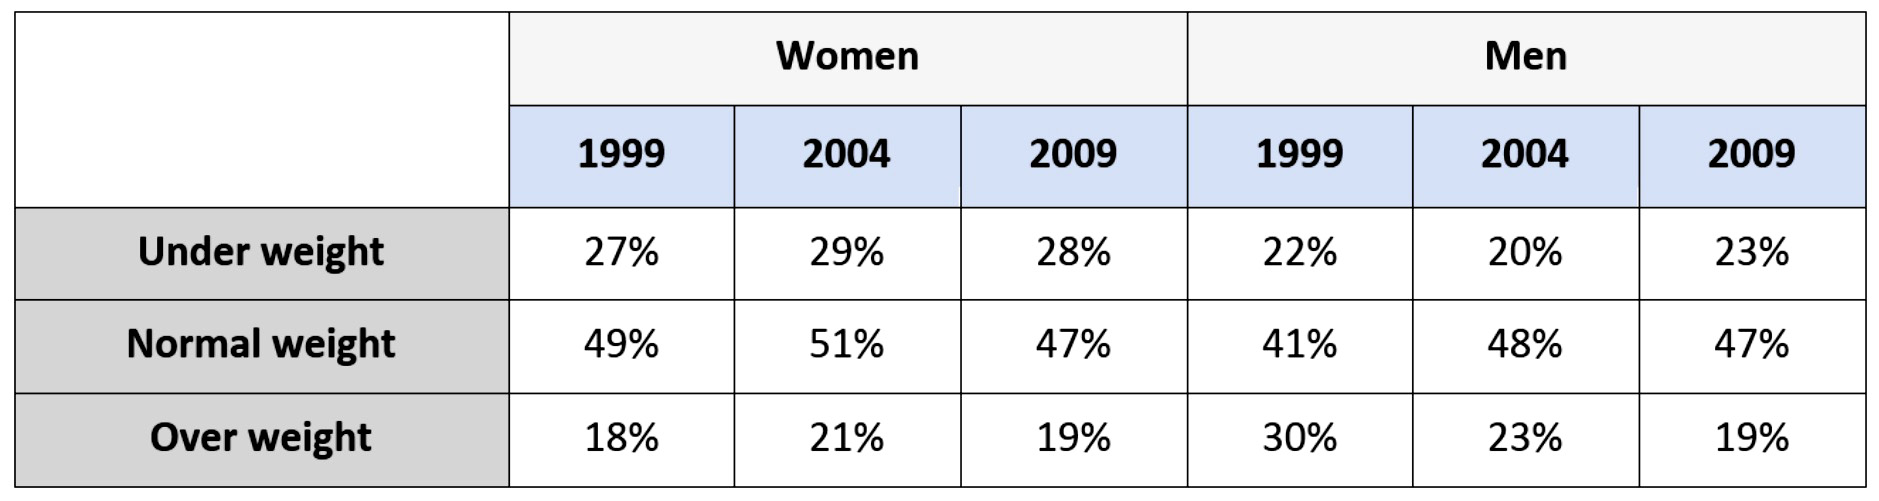
The table below shows the weight of people in a particular country from 1999 to 2009.
Write at least 150 words.
WRITING TASK 2
You should spend about 40 minutes on this task
Write about the following topic:
These days people in some countries are living in a “throw-away” society which means people use things in a short time then throw them away. Causes and problems.
Give reasons for your answer and include any relevant examples from your own knowledge or experience.
Write at least 250 words.
SAMPLE ANSWER IELTS WRITING TEST 17
The table illustrates the percentages of males and females at different physical fitness levels in a particular nation between 1999 and 2009.
Obviously, most women and men were at normal weight during the research period. While the percentage of overweight women increased, the reverse was true for men.
In 1999, 49% of women had a normal weight, while the figure for those who were underweight stood at about half of that percent. A similar pattern was seen in males but the figures were smaller, at 41% and 22% respectively. Overweight females made up 18% in that year, much lower than that of female counterparts, with 30%.
The percentages of underweight women and men both rose in 2004, to 51% and 48% respectively, before falling to 47% each in 2009. Similarly, overweight females and males accounted for smaller percentages of the population in 2004, at 21% and 23%, and both figures then went down to 19% each in 2009. Despite a rise of 2% in the first five years, the percentage of women with an underweight then decreased by 1%. However, the opposite trends were witnessed in underweight men’s percentage, with 20% and 23% respectively.
(194 words)
It is now common to see people purchase things, for example cell phones and clothes, and only use them for a short period. A number of factors contribute to this throwaway culture and this leads to a range of dire consequences, which will be outlined in the essay below.
One main reason for the modern throwaway culture is that society is greatly affected by consumerism that encourages the mass production of short-lived goods and the consumption of those goods. The market is also flooded with cheap, single-use products, making it easier to buy things in large quantities and dispose of them even before they become unusable. Another point to consider here is that the purpose for which we buy and use consumer products has changed over the past decades. For example, we no longer wait until our clothes wear out to make new purchases; instead, our decisions to buy new clothes are heavily influenced by a number of other incentives, be it better appearances or new fashion patterns.
This practice inflicts severe damage on the environment. Products constantly ending up in trash bins will cause landfills to become overloaded with massive piles of garbage, only a small proportion of which is disposed of properly to avoid harm to the environment. The rest of the garbage, usually non-recyclable and plastic items, is either buried underground or burnt. This can increase air and land pollution levels, and directly harm the lives of people living in the throwaway society. Furthermore, natural resources that fuel the manufacturing of consumer products can be depleted due to the market’s nonstop demand for those commodities.
In conclusion, a throwaway culture which wreaks devastation on our environment and depletes our natural resources is formed largely by modern consumerism.
(290 words)